Mobile Trends Holding Fast Q1 2015 – Q1 2016

In January 2016, eHealthcare Solutions published 2016 Benchmarks for U.S. Healthcare Publishers & Advertisers. The date range for the data in that whitepaper was January 2015 – December 2016. We’ve updated the data for Q1 2016. This article will focus on mobile trends from 2015 through 2016.
Tools and methods used in the analysis
eHealthcare Solutions analyzed over 377 million visitor sessions on healthcare publisher websites.
Tool: Google Analytics
Date Range: January 2015 – March 2016
Parameters: All sites chosen for analysis had at least 300,000 visitors per quarter. There were 32 web properties used in the analysis. Mobile numbers include tablet devices.
Segments:
1. Professional healthcare (HCP) v. consumer healthcare
2. Mobile v. desktop
Trends
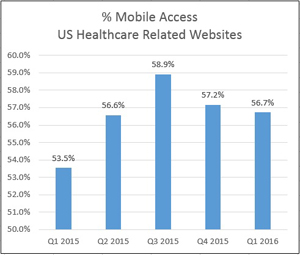
Mobile access on healthcare related websites in both consumer and healthcare professional segments rose steadily in the first three quarters of 2015. It decreased slightly in Q4 2015 and remained fairly even in Q1 2016.
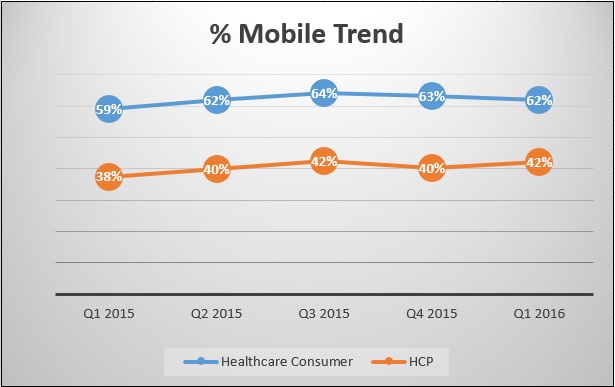
On websites with information for professional healthcare workers, mobile access has risen a total of 4% over the last 5 quarters:
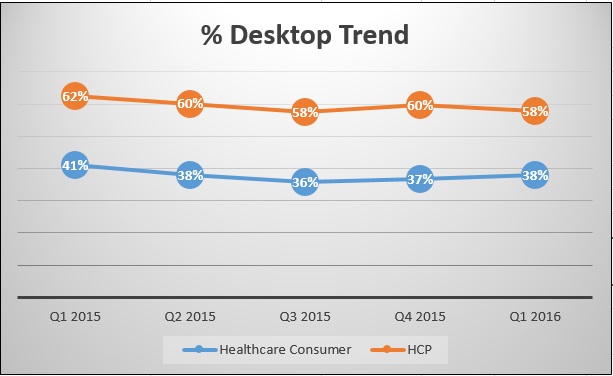
Whereas desktop has declined by 4% on HCP related websites:
Takeaways
- On consumer healthcare related sites, mobile is well over 50% of the traffic. All sites should be mobile responsive for the benefit of mobile visitors.
- Although mobile has not reached the 50% marker on professional healthcare sites, it is still rising. This is a good point to redesign for mobile responsiveness for HCP related sites to stay ahead of the curve.